I reinstalled Instagram on my mobile phone the other day.
My friend Beth Schillaci shamed me into it. She’s going to a Capitals playoff game (count me officially envious), and she’s posting pics on Instagram. And she told me, “You really need to get on Instagram.”
I know Instagram is huge. I’m just not sure it’s for me, but I will give it another try as my friends are using it to share more and more of their off-hours lives. Meanwhile, companies are using it very effectively to extend their brands. Look at Intel. Virgin America. Converse. Sharpie.
Of course, it’s not just Instagram. Visual content, across platforms, is huge.
What is “visual” content?
I’m a writer for a reason. I think in words first. I’ve had to train my brain to think more visually. But what constitutes visual content anyway?
There are some usual suspects:
- photographs
- videos
- infographics
- data visualizations
- word clouds
- interactive graphs and charts
Add visual recording to your arsenal.
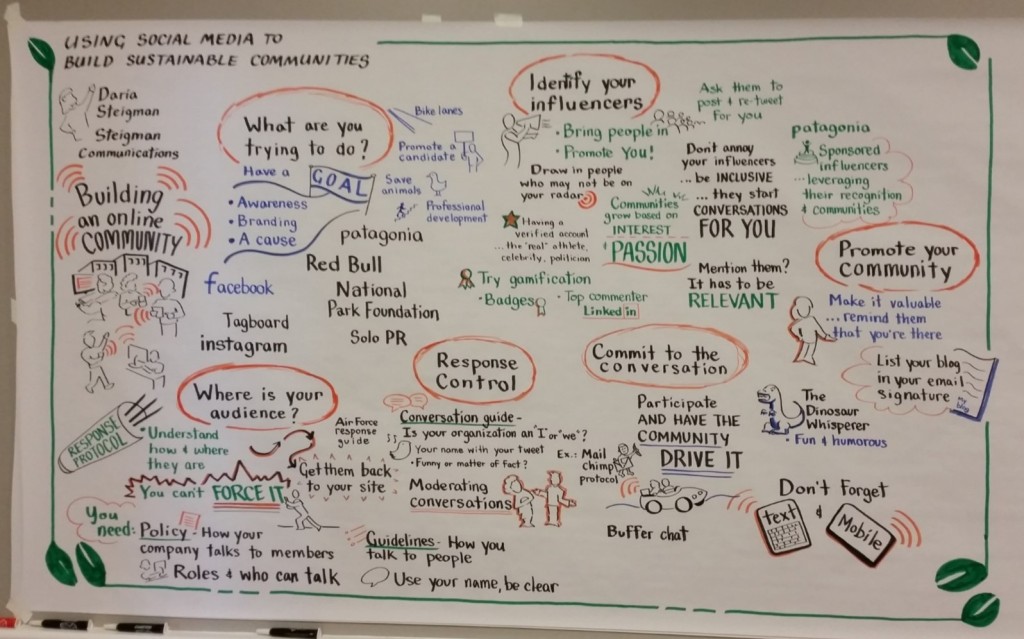
Visual (or graphic) recorders translate a talk or a conversation into images. You have probably seen at least an occasional “whiteboard” video talk, like this visual recording of a Daniel Pink talk on motivation.
I got to see visual recording in action recently.
The CBODN conference organizers retained eight visual recorders to create a visual tableau of every session. Trent Wakenight did mine–and it’s awesome.
What tools are you adding to your visual content arsenal?
PS: Click here to view a modified version of my presentation on Using Social Media to Build Sustainable Communities.